A small uptick in Richmond COVID-19 cases was reported by the BC Centre for Disease Control (BCCDC) in the days leading up to Halloween after four weeks of dropping cases.
From Oct. 24 to 31, there were 37 new cases detected – up by 29 from the previous week.
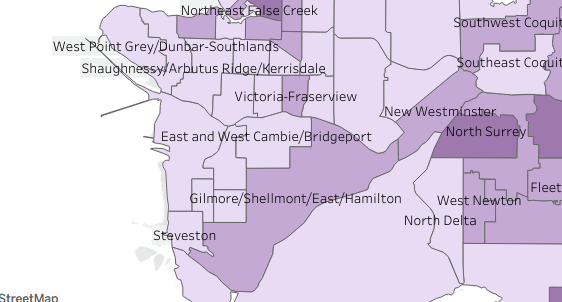
But more granular information from the BCCDC shows most areas of Richmond have low per-capita rates.
The highest rate was in the Gilmore/Shellmont/East/Hamilton area (see map), which had six cases for 100,000 residents while areas like Steveston, Blundell and City Centre only had one case for the same number of residents. (The Gilmore/Shellmont/East/Hamilton area is adjacent to New Westminster where there were also six cases per 100,000 residents.)
This data is from Oct. 26 to Nov. 1.
The second highest per-capita rate was in East-West Cambie/Bridgeport, which had four cases per 100,000 residents during this time period.
In the meantime, the number of COVID-19 cases across the province has seen a small decline over the past few days after stubbornly remaining in the 600-per-day range for several weeks.
Yesterday, the province reported there were 430 new cases across B.C. in a 24-hour period, of which only 56 were in Vancouver Coastal Health, which includes Richmond.
The total number of cases of COVID-19 in Richmond since January 2020 when the virus started spreading currently stands at 4,889.
COVID-19 cases per 100,000 residents (Oct. 26-Nov.1):
Gilmore/Shellmont/East/Hamilton: 6
East-West Cambie/Bridgeport: 4
Thompson/Seafair: 2
Broadmoor: 2
Steveston: 1
City Centre: 1
Blundell: 1


