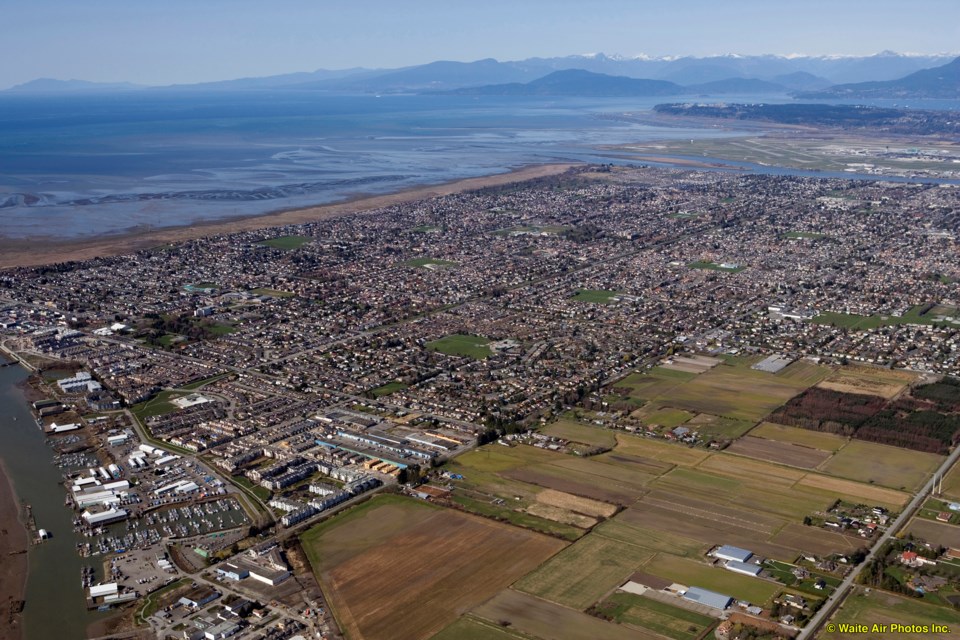
A new map revealing which areas in the Lower Mainland are most susceptible to climate change has highlighted Richmond’s vulnerability to flooding, ground-level ozone and higher summer temperatures.
Much of west Richmond, for example, has a high vulnerability to ground-level ozone, and Steveston is most likely to experience hotter temperatures in the summer than other areas of the city.
Richmond is most vulnerable, however, to flooding – and falls into the highest range of vulnerability on the map.
The project, which was carried out by researchers from the University of British Columbia in partnership with Vancouver Coastal and Fraser Health, measures how susceptible Lower Mainland communities are to climate change and its related health effects.
The researchers used data from each community, collecting over 35 indicators and reviewing more than 280 epidemiological papers, to create the vulnerability maps, which include higher temperatures, wildfire smoke events, ground-level ozone and flooding.
“Mapping vulnerability to the climate hazards that are relevant for our region can help target public health resources to the people and places most likely impacted,” said Michael Brauer, a professor in UBC’s School of Population and Public health, and the project’s lead researcher, in a press release.
The frequency and severity of climate-related hazards are expected to climb in coming decades, according to the release.
Those hazards are linked to premature death, infectious disease, heart and lung disease and cancer – risks which disproportionately affect children, seniors and people with low incomes.
A community’s overall vulnerability was calculated using three metrics: exposure to climate change events, sensitivity to those events (determined by age of the population and their pre-existing health conditions), and adaptive capacity (the community’s ability to adjust to climate change and its associated health risks).
Adaptive capacity was measured using factors such as income and social status, employment and education, race, gender and the existence of hazard response plans.
Here are the vulnerabilities identified in Richmond:
Ground-level ozone
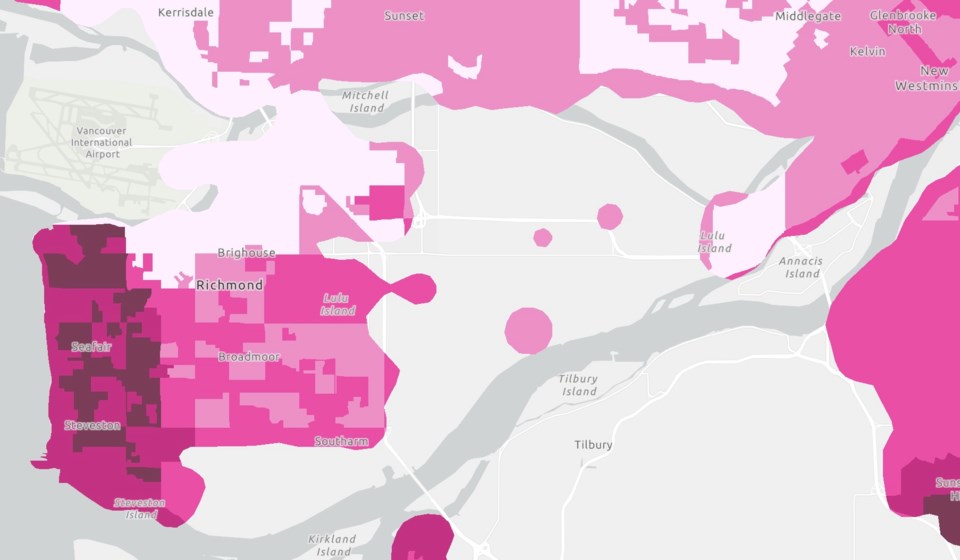
This map reveals that Richmond’s vulnerability to ground-level ozone is a patchwork, falling into the very low to very high ranges.
Most of west Richmond, from Steveston to Terra Nova – areas which had very high exposure – show high to very high ground-level ozone vulnerabilities, while the rest of the city has very low to moderate vulnerabilities.
Ground-level ozone forms above just above the earth’s surface when sunlight reacts to stagnant air.
According to Environmental Reporting BC, exposure to ozone can lead to an increase in asthma or respiratory symptoms, as well as more emergency room visits and hospitalizations.
Richmond’s sensitivity to ground-level ozone largely falls into the very low to low ranges, while the city’s adaptive capacity is, for the most part, very low.
Higher summer temperatures
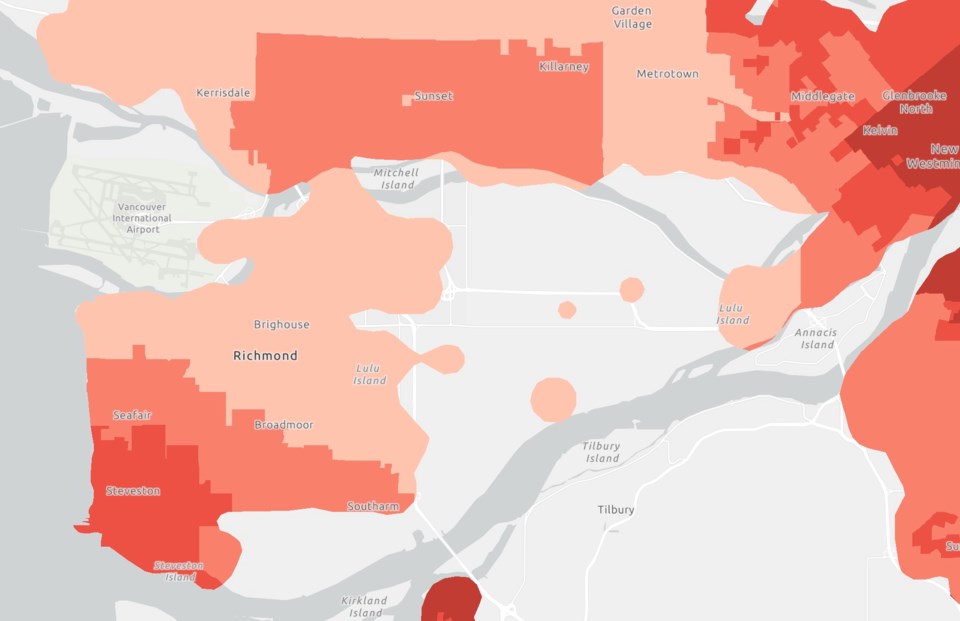
Overall, Richmond has less vulnerability to higher summer temperatures than other areas of the Lower Mainland, such as Tsawwassen, White Rock and Maple Ridge, which have very high vulnerabilities; or large parts of Surrey and the District of North Vancouver, which fall in the high range.
Richmond’s vulnerability to heat is the highest in Steveston, falling into the moderate range on the map. Other areas of the city are at low to very low risk of higher summer temperatures.
Overall, Richmond’s sensitivity to extreme heat is very low, apart from a small area near Shady Island, which has moderate sensitivity.
However, the data shows that Richmond’s adaptability to extreme heat events falls into the low to very low ranges.
Wildfire smoke events
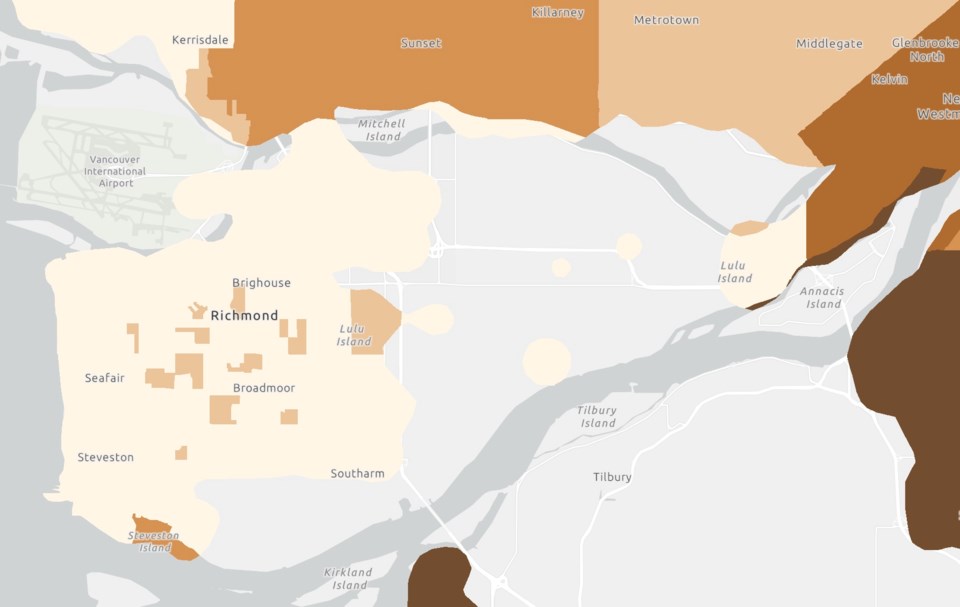
When it comes to vulnerability to wildfire smoke, the majority of Richmond falls into the very low range.
However, while most of the Hamilton neighbourhood also has very low vulnerability to wildfire smoke, that changes to a high vulnerability at the border to New Westminster, and very high near the Annacis Channel.
Toggling the three metrics used to calculate overall vulnerability show that Richmond also has had very low exposure to wildfire smoke, and for the most part also falls in that range for sensitivity (measured by age of the population and pre-existing health conditions).
Exposure to wildfire smoke is represented by the number of days with PM2.5 concentrations above 25ug/m3 over the five most severe wildfire seasons between 2009 and 2018, according to the map.
However, the city’s ability to adapt is more fragmented, a patchwork that falls into very low to very high ranges.
Flooding
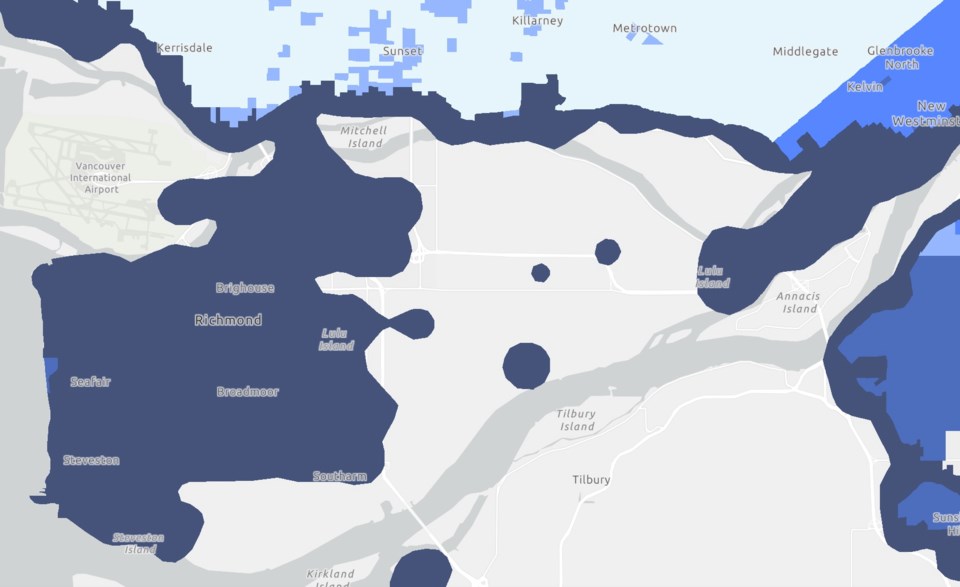
While Richmond’s vulnerability to the other categories falls into moderate to lower ranges, the city’s vulnerability to flooding is very high.
Toggling to the exposure metric, the city is coloured a dark blue on the map, which indicates very high exposure.
Exposure to flooding is represented on the map by predicted sea level rise in waterways and rivers by 2100.
Richmond’s sensitivity is very low, while adaptive capacity – the ability to adapt to climate events and associated health risks – fell into the moderate to high ranges.
Sharing data
Vancouver Coastal Health and Fraser Health are now sharing the data with municipalities, regional districts, First Nations, among others, in the hopes that it can help build “more resilient communities,” according to a press release.
“Climate change is one of the biggest challenges facing our communities,” said Dr. Michael Schwandt, VCH medical health officer, in the release.
“We can use the information from the index to work with municipalities to build up their capacity to respond. For example, we can see which communities may be more affected by heat, and work with municipalities to develop response plans in those communities, such as opening cooling stations for people during a heat wave.”
The maps are also available online.
Over time, the maps will be updated to reflect community preparedness and changing demographics.


