Richmond’s official population inched closer to 200,000 people, according to the 2016 Census, making it the 25th largest city in Canada. But, what piqued the curiosity of urban planner Andy Yan was in where the population increased, or, more precisely, where it declined.
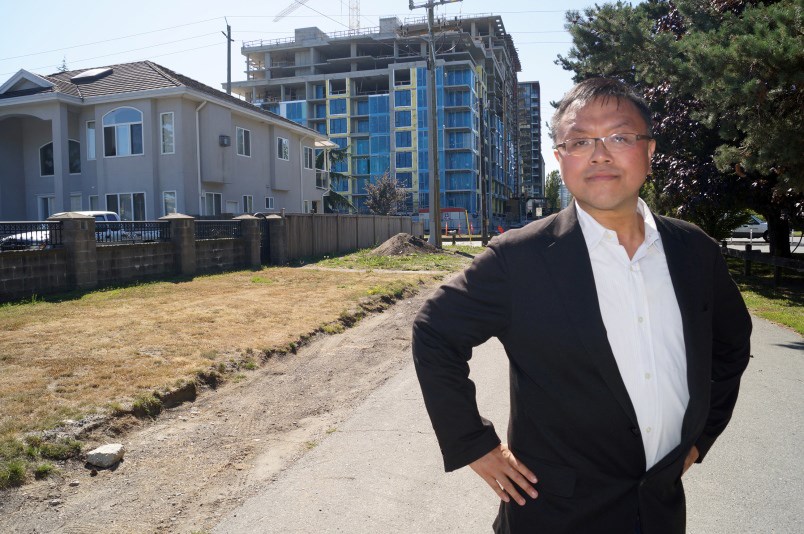
“The story in Richmond is the exodus out of the west side,” said Yan, director of the City Program at Simon Fraser University.
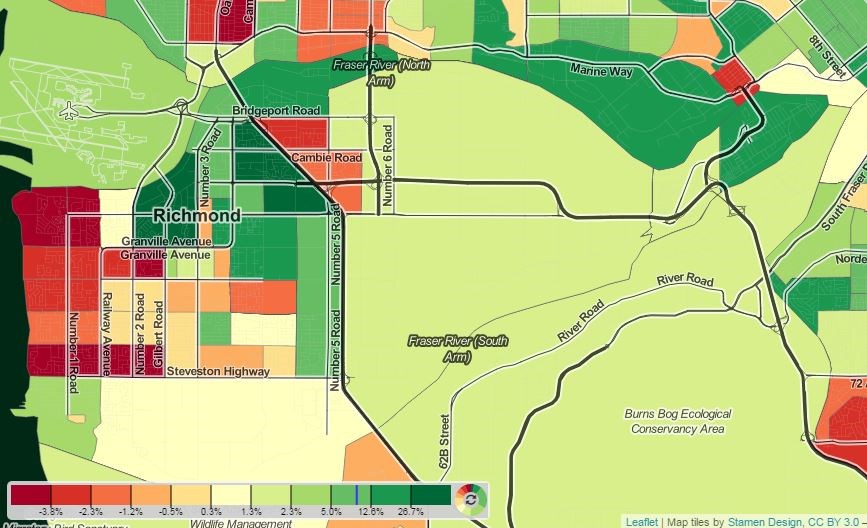
“It’s a tale of two cities. There are areas of Richmond that have grown significantly. But at the same time we’re seeing many census tracts that have lost between two and five per cent of its population,” added Yan.
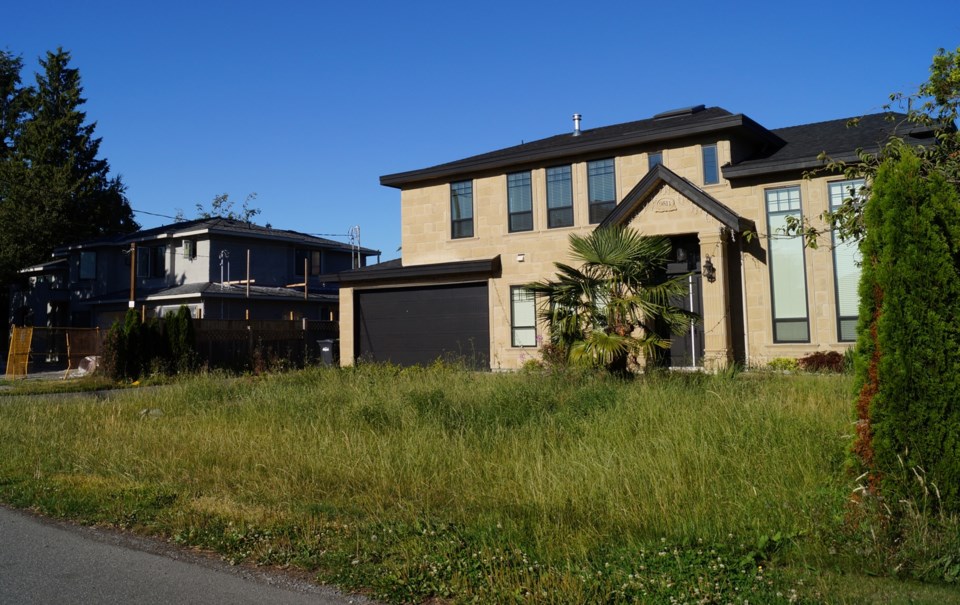
Save for one neighbourhood — that of Dover Park, which saw a 0.6 per cent increase in residents — all of West Richmond, which is predominantly dominated by detached homes, saw a decline in population to varying degrees.
“The areas that lost the most people are the areas with expensive single-family homes,” explained Yan.
“This aligns with areas of Vancouver, such as Kerrisdale and Shaughnessy, and parts of central Burnaby” said Yan.
The Richmond neighbourhood, or census tract, with the sharpest decline was a portion of Terra Nova, east of No. 1 Road and north of Granville Avenue, which saw an 8.5 per cent drop, with 255 residents moving out between 2011 and 2016. Another area that saw a sharp population decline was the neighbourhoods south of the intersection of No. 2 Road and Williams roads.
Yan noted there are likely two main causes for these population drops in single-family neighbourhoods. One, older adults are becoming “empty-nester” seniors and aging in place as their young adult children move out. Two, the homes have become too unaffordable for new families to move in. As such, they’re being purchased by foreigner investors or speculators.
“You can’t own these homes on local incomes . . . I think that’s just a reality of what’s happening in that area of Richmond,” said Yan.
Areas that saw the most growth are City Centre (37 per cent) and West Cambie (33 per cent), popular places for new condos and townhouses, respectively. Another high growth area is the McLennan neighbourhood, south of Westminster Highway and east of Garden City Road, which saw a 13 per cent spike in people thanks to many new townhouses.“There is a good story here,” said Yan.
“We’re densifying in areas where we should be densifying. That comes into our discussion of meeting our goals of sustainability,” he added.
But as populations shift, city planners will need to adjust, said Yan.
“The significance of this comes in with public amenities like schools; and issues of density and supporting local businesses. What happens when you have one area of Richmond lose six per cent of its population? That’s a profound challenge.”
These trends align with the present-day challenges of the Richmond School District.
School planners are seeking land for a new City Centre school and McLennan’s Anderson elementary is getting a new, eight-classroom expansion set for completion this September. Meanwhile, West Richmond schools were threatened with closures last year due to declining enrollment. For example, the Dixon elementary catchment has seen a 15 per cent decline in school-age children during the past 10 years, according to district data.
Meanwhile, city planners have some new tools to combat population loss on the west side, after council recently approved more multi-family unit zoning along arterial roads. Long-term plans for neighbourhood shopping centres, such as Seafair and Blundell, call for condo development, as well.
The new census data was only for population and dwelling counts. Ethnicity and income, among other data, will be released later this year.
Over the past five years, Richmond increased its number of residential “dwellings” by 8.9 per cent, which is slightly higher than the Lower Mainland average of 8.2 per cent (Surrey and Langley account for the highest growth).
Yet, Richmond’s population grew by just 4.1 per cent — since the last census in 2011 — below the regional mark of 6.5 per cent.
Richmond No. 4 for empty homes
Yan said he was surprised to see Richmond ranked fourth among Metro Vancouver municipalities for percentage of non-resident unoccupied homes (4,021 dwellings out of 77,478 total).
“Non-resident unoccupied dwellings,” as they are deemed in the census, are either homes that are outright empty or ones occupied by foreigner or temporary resident. Yan noted regional data show that the vast majority (85 per cent) of non-resident unoccupied dwellings are, in fact, empty.
“I had thought there would be a lot more in Richmond but apparently not,” said Yan.
However, Yan said Richmond saw a significant spike in unoccupied homes since 2011, at 26 per cent (3,194 unoccupied in 2011). By contrast, Vancouver’s 25,502 unoccupied dwellings represented a 15 per cent spike since 2011.
“In the face of the significant housing challenges for those on local incomes in Vancouver, we still have a high rate of non-resident unoccupied houses,” said Yan.
So, what does this mean? Yan was asked.
“Well, what is housing? Is it supposed to house people or is it supposed to house, well, not people?”
Yan said the empty homes spike corresponds to the increased popularity of short-term rentals during the past five years in Richmond.
“You reach the dilemma of when residential properties are used for business purposes,” said Yan, noting residential zones are taxed about 3.5 times less than commercial zones.
Looking deeper at census tracts, most unoccupied homes are in the City Centre area. For instance, the tract at the Richmond Olympic Oval, which only contains the River Green development, shows 21 per cent unoccupied dwellings.
“It could mean it’s a commercial success but not a community success,” said Yan.


